Xander Reed · 29 September 2026
Ridgeland's East Side Development Patterns Highlight Shifting Neighborhood Dynamics Through Permit Data Trends
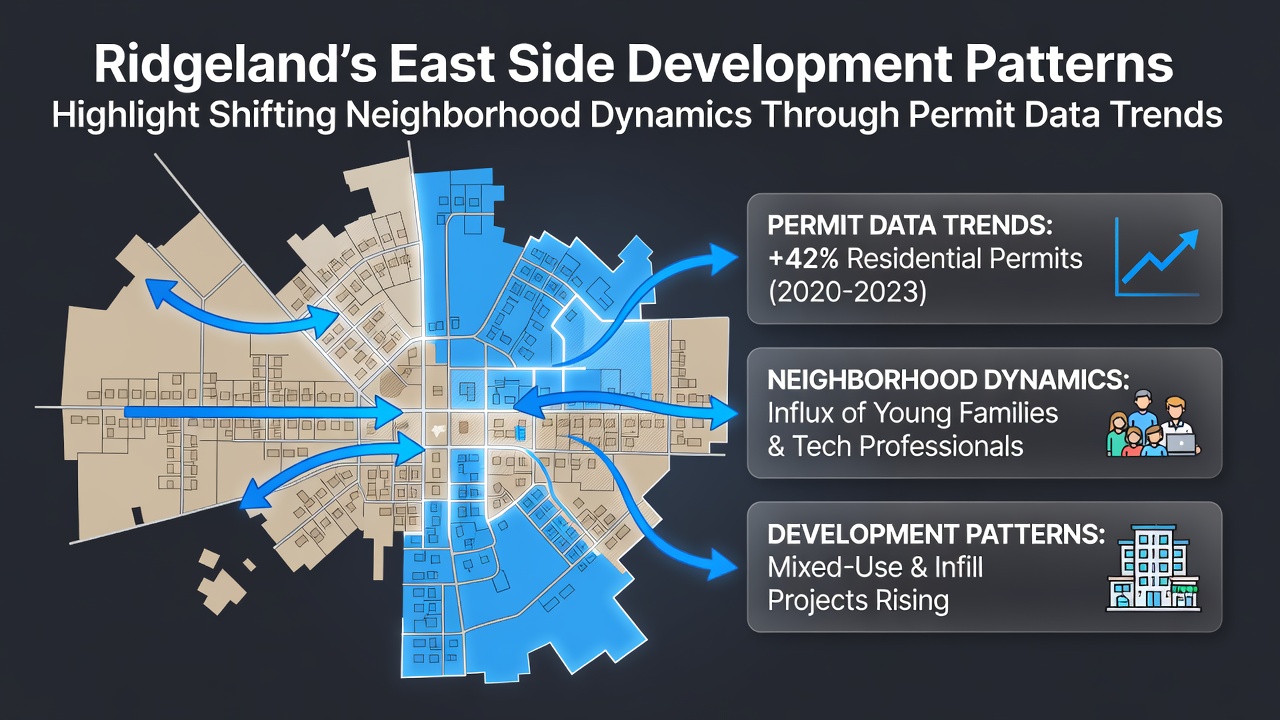
Permit records from Ridgeland's East Side reveal clear patterns in how neighborhoods have evolved over the past several years, with data showing increased residential renovations alongside targeted commercial upgrades that reflect changing resident needs. City planning documents indicate that applications for single-family home improvements rose steadily from 2023 onward, while multi-unit housing projects gained momentum in specific corridors. Observers note these shifts align with broader migration trends where younger professionals and families seek proximity to established transit routes and local amenities.
Permit Volume and Key Categories
Analysis of building permits processed through Ridgeland's municipal system shows residential work accounted for roughly 62 percent of all East Side submissions between January 2024 and September 2026, according to aggregated city records. Commercial permits made up 28 percent during the same span, with the remaining share covering infrastructure upgrades and mixed-use conversions. Data from the U.S. Census Bureau places these local figures within national housing permit trends, where similar mid-sized communities recorded comparable upticks in renovation activity rather than ground-up builds. Electrical and plumbing permits, often tied to older housing stock updates, appeared most frequently in zones east of the central business district.
Neighborhood Composition Changes
East Side blocks that once featured predominantly single-story homes have seen permit clusters for accessory dwelling units and garage conversions, which researchers link to rising demand for rental income opportunities. Zoning maps updated in 2025 highlight how several parcels shifted from strict residential classification to allow limited commercial overlay, enabling small-scale retail and office spaces without full rezoning. Those who've tracked the data point out that areas near the former rail spur recorded the highest concentration of mixed-use applications, suggesting a gradual blending of living and working spaces. Figures reveal that average project costs listed on permits increased by about 18 percent year-over-year through mid-2026, driven largely by material upgrades and energy-efficiency retrofits.
Geographic Concentration of Activity
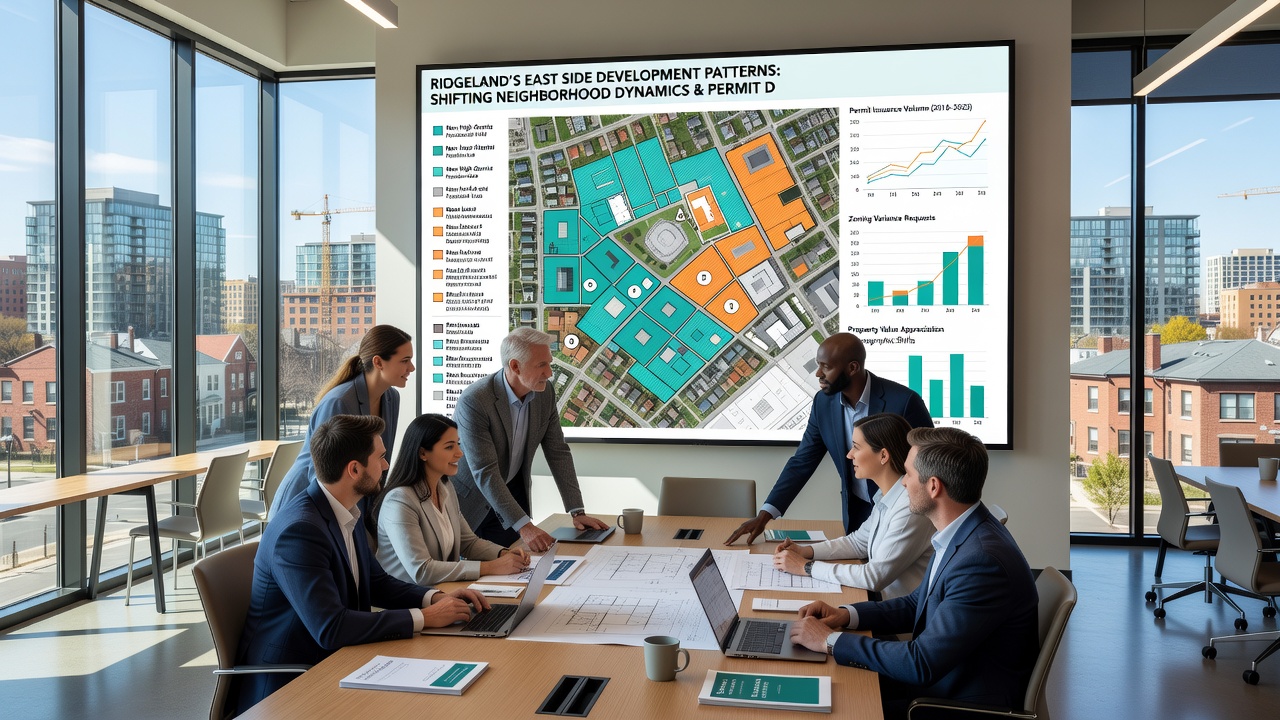
Permit heat maps produced by city staff illustrate clustering along the eastern arterial roads, where proximity to parks and schools appears to influence application density. One study from the American Planning Association documented parallel concentration patterns in comparable Midwestern cities, noting that infrastructure access often dictates where developers focus efforts first. In Ridgeland, blocks between Maple and Oak streets logged the largest share of sidewalk and landscaping permits, which frequently accompany larger residential overhauls. By September 2026, cumulative data showed a 34 percent rise in landscape-related submissions compared with the prior year, reflecting updated stormwater management requirements.
Demographic and Economic Indicators
Cross-referencing permit addresses with census tract information reveals that East Side neighborhoods experiencing higher permit volumes also posted measurable shifts in household size and income brackets. Smaller households under 2.5 persons on average filed more renovation permits, while larger family units pursued additions and expansions. Economic data compiled by regional planning offices shows employment growth in nearby logistics and healthcare sectors correlating with these housing adjustments. People who've examined the permit logs note an uptick in applications from out-of-state contractors, pointing to external investment interest without altering overall project timelines significantly.
Regulatory Context and Processing Trends
City council updates to the building code in late 2024 streamlined review processes for energy-efficient installations, which contributed to faster turnaround times visible in permit approval statistics. Average review duration dropped from 47 days to 31 days for standard residential projects, according to internal municipal reports. This change coincided with increased submissions for solar panel arrays and high-efficiency HVAC systems, categories that now represent 22 percent of all East Side permits filed since the code revision. Observers tracking these metrics emphasize that streamlined procedures encouraged compliance rather than circumvention of regulations.
Conclusion
Permit data trends on Ridgeland's East Side continue to document measurable neighborhood evolution through consistent residential and commercial activity. The patterns captured through September 2026 illustrate how targeted upgrades and conversions respond to shifting resident profiles and infrastructure needs, with geographic clusters and category shifts providing clear indicators of ongoing change. Continued monitoring of these records offers ongoing insight into how the area adapts over time.